Performance Reporting
05th June 2017 Simon Steed

Your sales team fight in the trenches to win new business, while your marketers piece together intelligence from this that will direct their efforts efficiently and effectively. That is the hope, anyway. Because better quality information means better decision making. Bridging this gap of reporting and analysis in a meaningful way can prove to be a real challenge.
Here we will guide you through some of the key points that will ensure you have both helpful and effective business performance reporting practices in place that will help you closely monitor and achieve meaningful goals.
Choosing Effective KPI’s and Setting the Right Goals
Key performance indicators (KPI’s) are measurable values which demonstrate how successful an organisation has been at reaching targets. They can be tied to pretty much any metric that gives a good and reliable indication of success or failure of a process. Sales metrics and KPI’s for instance, may help inform the marketing department as to how well the current campaign by the sales team is going. SEO metrics and KPIs may help indicate whether your online marketing efforts are attaining the desired level of visibility and traffic.
Choosing the right KPI is also important. It would be easy to monitor and chase ‘vanity’ numbers such as how many contact form enquiries you had on a particular week, or how many retweets you received. But these would be meaningless if they didn’t also take into account whether these interactions resulted in a sale.
Agreeing attainable goals are also important to staff morale: targets that are too difficult to realistically achieve will likely have a detrimental impact. Similarly, setting goals that are too easy might result in laziness, complacency or lack of focus. As with all parts of business reporting, it’s worth re-visiting this periodically to monitor the effectiveness of any existing system.
Using Visualisations Effectively
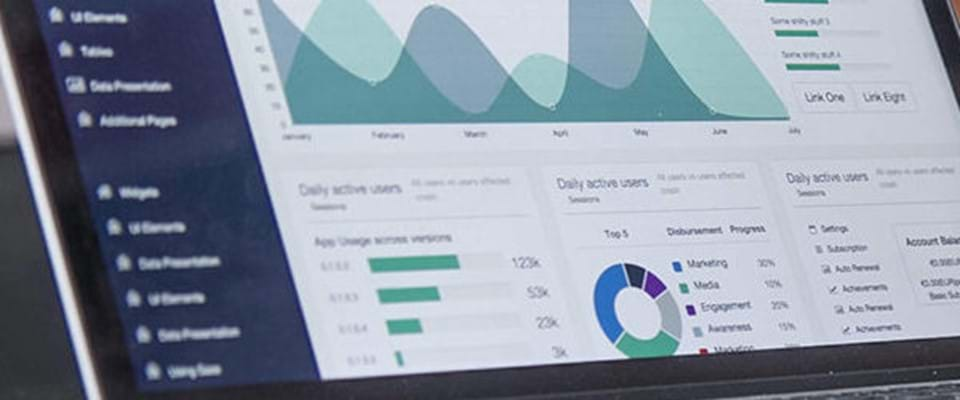
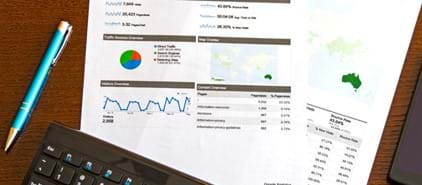
Visualising data in the form of graphs and charts can be a highly effective way of communicating complex data in an intuitive and easy to understand fashion. They can also be good for both identifying and highlighting specific patterns and trends which may emerge.
This effective communication of data is vital, since part of the reporting gap we highlighted at the start can depend on one department within your company communicating with another.
With more people able to interpret the information, further opportunities may emerge that help to highlight also lead to further opportunities to refine and filter the data to help tease out any other factors.

